this post was submitted on 17 Mar 2024
2773 points (99.2% liked)

Science Memes

11161 readers
1816 users here now

Welcome to c/science_memes @ Mander.xyz!

A place for majestic STEMLORD peacocking, as well as memes about the realities of working in a lab.


Rules

  1. Don't throw mud. Behave like an intellectual and remember the human.
  2. Keep it rooted (on topic).
  3. No spam.
  4. Infographics welcome, get schooled.

This is a science community. We use the Dawkins definition of meme.


Research Committee

Other Mander Communities

Science and Research

Biology and Life Sciences

Physical Sciences

Humanities and Social Sciences

Practical and Applied Sciences

Memes

Miscellaneous

founded 2 years ago
MODERATORS
 
you are viewing a single comment's thread
view the rest of the comments
[–] veganpizza69@lemmy.world 3 points 8 months ago (1 children)

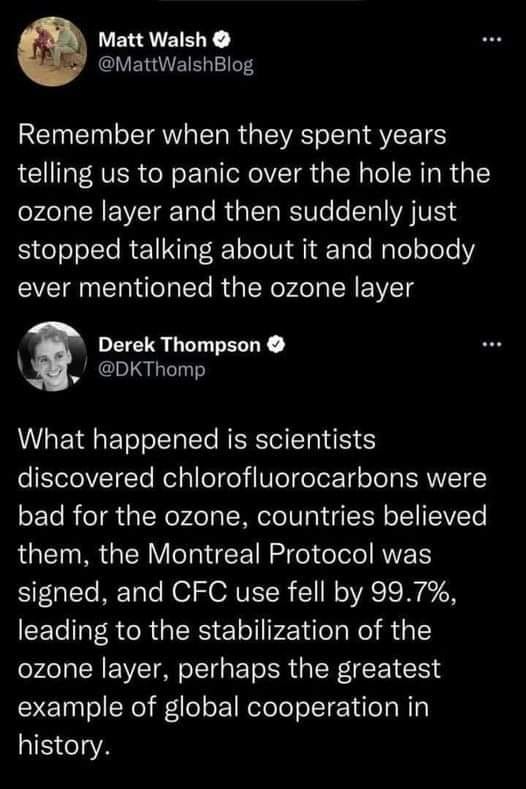
I was thinking of this paper from 2018:

ACP - Evidence for a continuous decline in lower stratospheric ozone offsetting ozone layer recovery

Abstract. Ozone forms in the Earth's atmosphere from the photodissociation of molecular oxygen, primarily in the tropical stratosphere. It is then transported to the extratropics by the Brewer–Dobson circulation (BDC), forming a protective ozone layer around the globe. Human emissions of halogen-containing ozone-depleting substances (hODSs) led to a decline in stratospheric ozone until they were banned by the Montreal Protocol, and since 1998 ozone in the upper stratosphere is rising again, likely the recovery from halogen-induced losses. Total column measurements of ozone between the Earth's surface and the top of the atmosphere indicate that the ozone layer has stopped declining across the globe, but no clear increase has been observed at latitudes between 60° S and 60° N outside the polar regions (60–90°). Here we report evidence from multiple satellite measurements that ozone in the lower stratosphere between 60° S and 60° N has indeed continued to decline since 1998. We find that, even though upper stratospheric ozone is recovering, the continuing downward trend in the lower stratosphere prevails, resulting in a downward trend in stratospheric column ozone between 60° S and 60° N. We find that total column ozone between 60° S and 60° N appears not to have decreased only because of increases in tropospheric column ozone that compensate for the stratospheric decreases. The reasons for the continued reduction of lower stratospheric ozone are not clear; models do not reproduce these trends, and thus the causes now urgently need to be established.

and this paper from 2023:

Potential drivers of the recent large Antarctic ozone holes | Nature Communications

The past three years (2020–2022) have witnessed the re-emergence of large, long-lived ozone holes over Antarctica. Understanding ozone variability remains of high importance due to the major role Antarctic stratospheric ozone plays in climate variability across the Southern Hemisphere. Climate change has already incited new sources of ozone depletion, and the atmospheric abundance of several chlorofluorocarbons has recently been on the rise. In this work, we take a comprehensive look at the monthly and daily ozone changes at different altitudes and latitudes within the Antarctic ozone hole. Following indications of early-spring recovery, the October middle stratosphere is dominated by continued, significant ozone reduction since 2004, amounting to 26% loss in the core of the ozone hole. We link the declines in mid-spring Antarctic ozone to dynamical changes in mesospheric descent within the polar vortex, highlighting the importance of continued monitoring of the state of the ozone layer.

[–] pheet@sopuli.xyz 3 points 8 months ago

Unfortunately there can still be emissions:

https://www.nature.com/articles/s41586-019-1193-4

From abstract:

A recently reported slowdown in the decline of the atmospheric concentration of CFC-11 after 2012, however, suggests that global emissions have increased3,4. A concurrent increase in CFC-11 emissions from eastern Asia contributes to the global emission increase, but the location and magnitude of this regional source are unknown3. Here, using high-frequency atmospheric observations from Gosan, South Korea, and Hateruma, Japan, together with global monitoring data and atmospheric chemical transport model simulations, we investigate regional CFC-11 emissions from eastern Asia. We show that emissions from eastern mainland China are 7.0 ± 3.0 (±1 standard deviation) gigagrams per year higher in 2014–2017 than in 2008–2012, and that the increase in emissions arises primarily around the northeastern provinces of Shandong and Hebei.