Best conversation ever!
klay1
joined 1 year ago
where is that diagram that compares various methods of adapting to sunlight over the year? There was one that always had sunrise at 8 am or something and more. I can't seem to find the right one.
It looks exactly like this one but comparing other methods: https://upload.wikimedia.org/wikipedia/commons/7/7a/Greenwich_GB_DaylightChart.png

I support the attempts to delete DLT and so on because the time shift has negative psychological effects and stress on so many people.
But me personally i don't care at all. I guess i am lucky to be naturally an early bird, having a flexible job nearby, no family and so on. It does not matter if i wake up a 7 or 8.
exactly this. Spreadsheets are so simple to understand that people think and communicate in spreadsheets. Managers don't understand how much they fucking love them. Its like a cult. They make everybody meet 5 times a week to look at various spreadsheets together. And don't see how ineffective they often are.
"we have a problem? Ok lets make a spreadsheet! Oh, the problem wasn't solved yet? Ok then look at the spreadsheet every week now!"
in Thailand i usually ordered non spicy at all. Just on time i ordered my pat Thai with the tiniest bit of spicy, making very clear they got the point. I couldn't eat it.
i agree that AI is a bubble of trash but shutting off a part that wasn't worth the cost is not an indication of an end. They just reduced cost to extend the financial runway. From my point of view text and coding were more popular anyway.
i had some dates with a girl who looked at me like that. Exactly this critical facial expression... 🤔
I don't know, man. What if its cloudy?
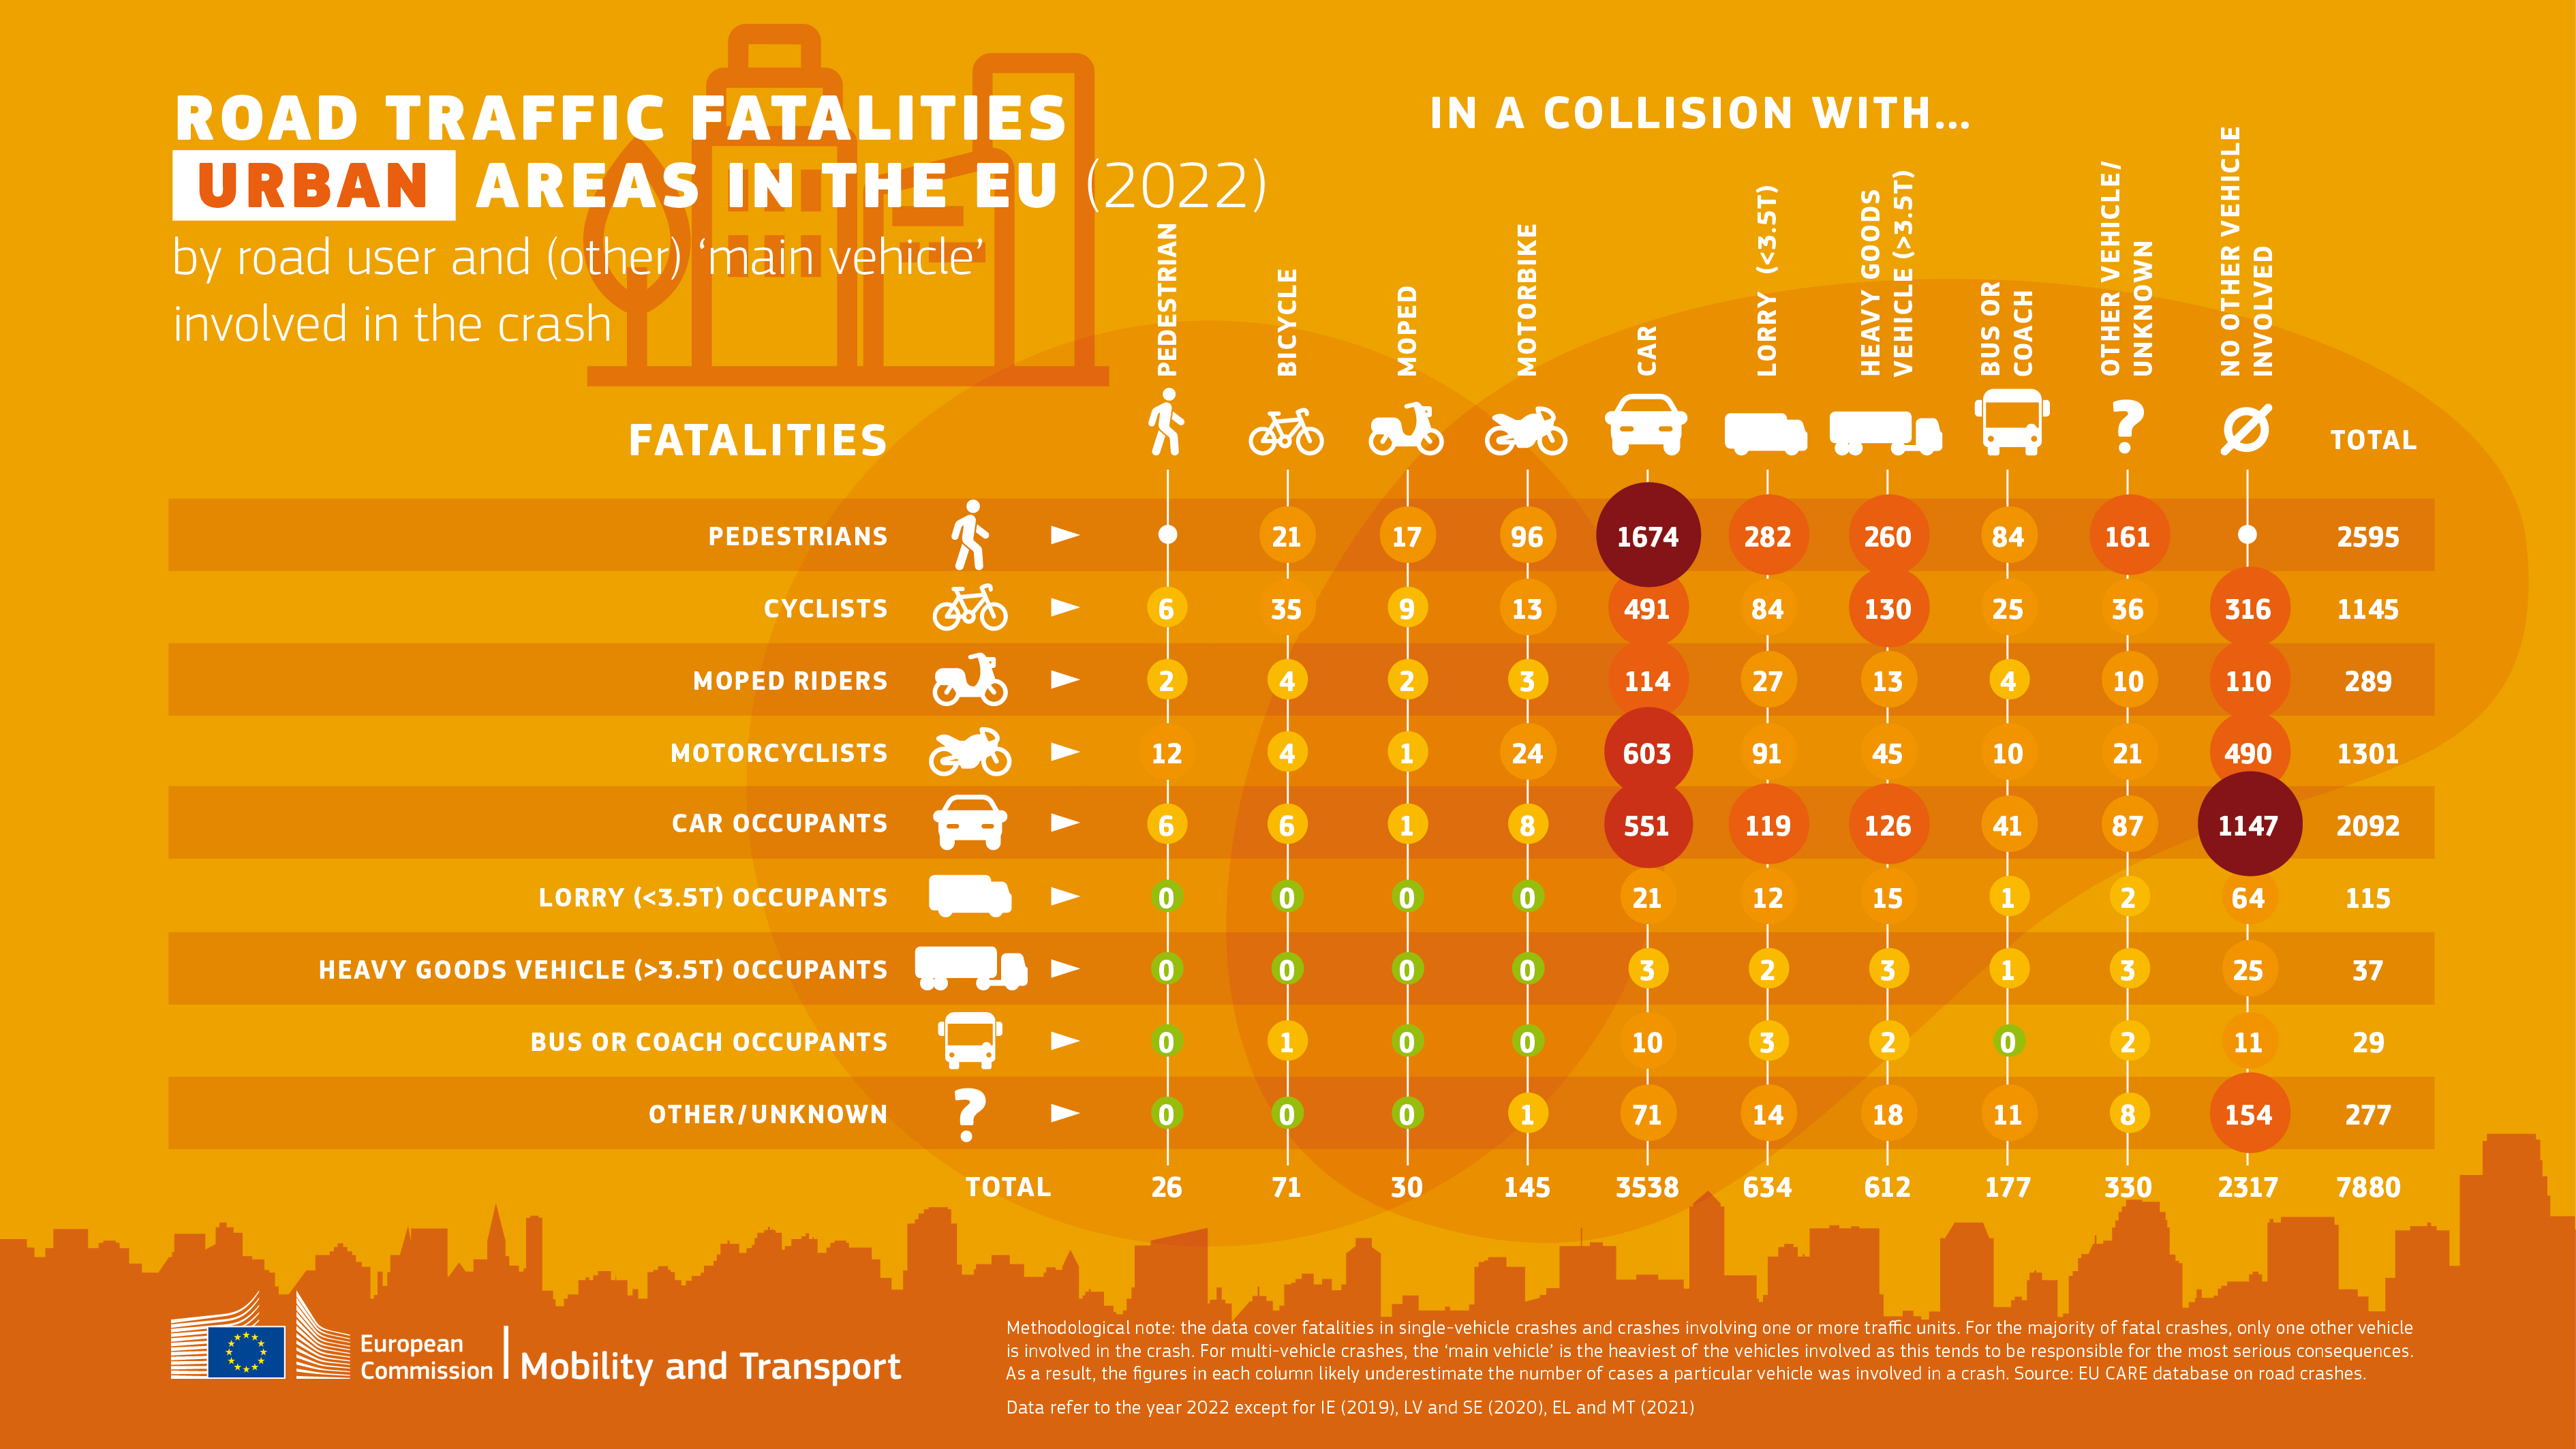
But then obviously pedestrians or cyclists don't compare in distance by far. Cars drive autobahns and whatnot. There should be a statistic for daily use instead. Like: ride the bike to work versus drive the car to work versus take the train to work, etc. How many people die?
there are significantly more cars around than bikes.
I see what you mean and agree, that relative numbers would be nice. But what would the counter argument be? That if there were more bikes, then bike-related deaths would rise more than car-related deaths would shrink? It would be hard to prove that.
Also, the matrix for cities still shows cars as a much bigger problem, while European cities have plenty of cyclists. Again, relative numbers would be nice. Or a comparison between a dutch city and a polish city, for example. But if i compare both tables (overall vs cities), i am certain the argument holds.

view more: next ›
you did pay with your usage data.